Key Findings & Solutions | Turning Insight into Action | Interactive Data Dashboard | Interactive Household Budgets Calculator | Resources | Interview and Speaker Requests | Partner with Us | Methodology | Previous Studies
The Real Cost Measure in California
Redefining “Low Income”
To help families and individuals with low incomes move up economically, so they can live with dignity and agency, we need measures that point the way to a decent standard of living. Unfortunately, the official federal poverty measure and others built on it don’t do that; they aren’t able to show the often significant gap between our aspirations for families and what those families actually earn.
That’s why we created the Real Cost Measure, designed to show the true cost of living in California and provide insights into how we can support initiatives to help all Californians build financial security. When more than one in three California households don’t earn enough to meet their basic needs—roughly three times the proportion considered to be living in poverty when using the federal poverty level—we need to adjust our metrics.
At United Ways of California, we believe everyone deserves the opportunity to live their best life. From strengthening local resilience to advancing health, youth opportunity, and financial security, we are working toward a vision of an equitable California where every individual has the resources and opportunities they need to thrive.
The Real Cost Measure puts a stake in the ground for what people need to live with dignity and provides insights into the specific situations of struggling Californians—such as the number of adults and children in the household as well as the head of household’s educational attainment, gender, and ethnicity—that communities can use to develop approaches targeted to community members’ different challenges.
2025 Study: Breaking Barriers, Building Opportunity
United Ways of California, in partnership with California’s network of local United Ways, is proud to release The Real Cost Measure in California 2025, our latest study on what it takes to make ends meet in California as well as ways we can collectively use this data to create a California where more households have the opportunity for financial security. In addition to statewide insights and data highlighted in the Executive Summary and below in our Key Findings, we also continue to provide more localized data and information to understand the Real Cost Measure in the context of your community.
 Read the Executive Summary
A Decade in Review
In the ten years we’ve published the Real Cost Measure study, one especially notable data point remains stagnant—for about 1 in 3 California households, even a modest level of security remains elusive. This year, we explored how the data have changed over the past decade and what systemic and historical inequities are contributing to stagnation and continued or worsening gaps. While we’ve seen some improvements in certain areas since 2015, the key takeaway remains the same: we must urgently do more to support households that fall below the Real Cost Measure, leaning heavily into income support programs and legislation proven to enhance financial security. We highlight examples of these in this year’s study report.
Expenses have risen over the past decade
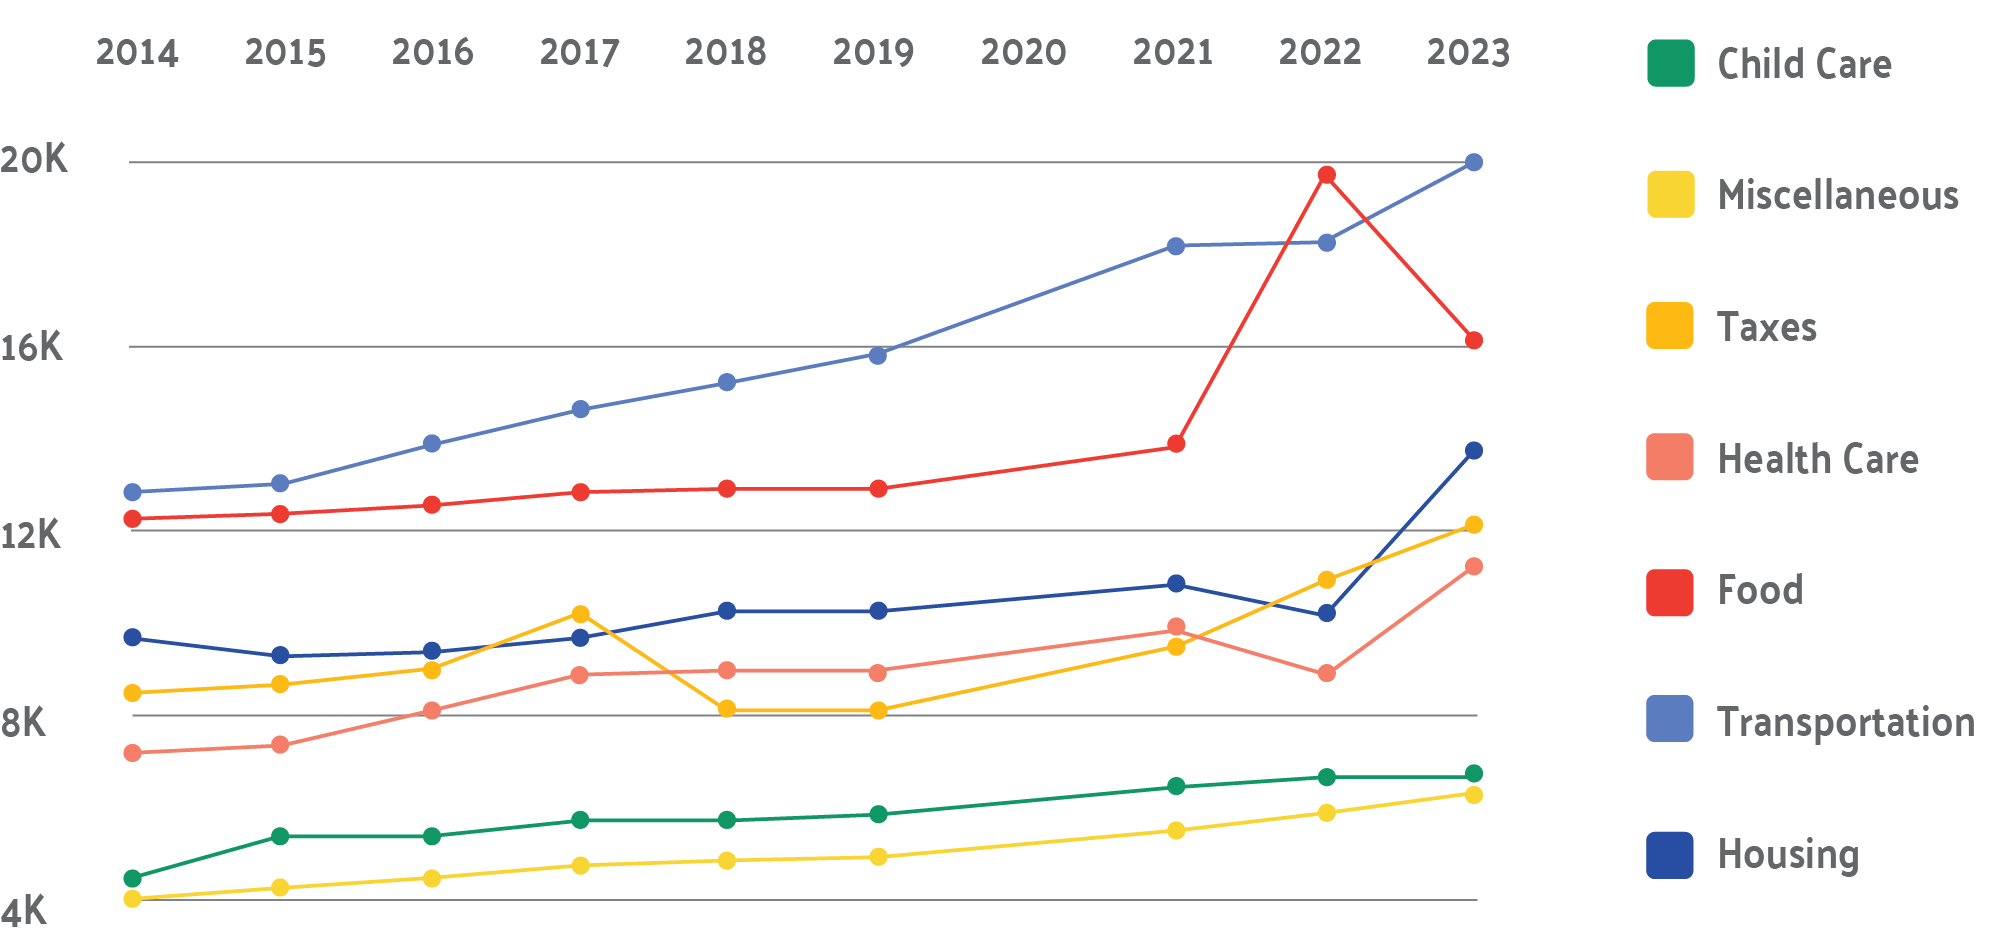
The 2025 RCM Study draws from 2023 publicly available data.
.
Key Findings & Solutions
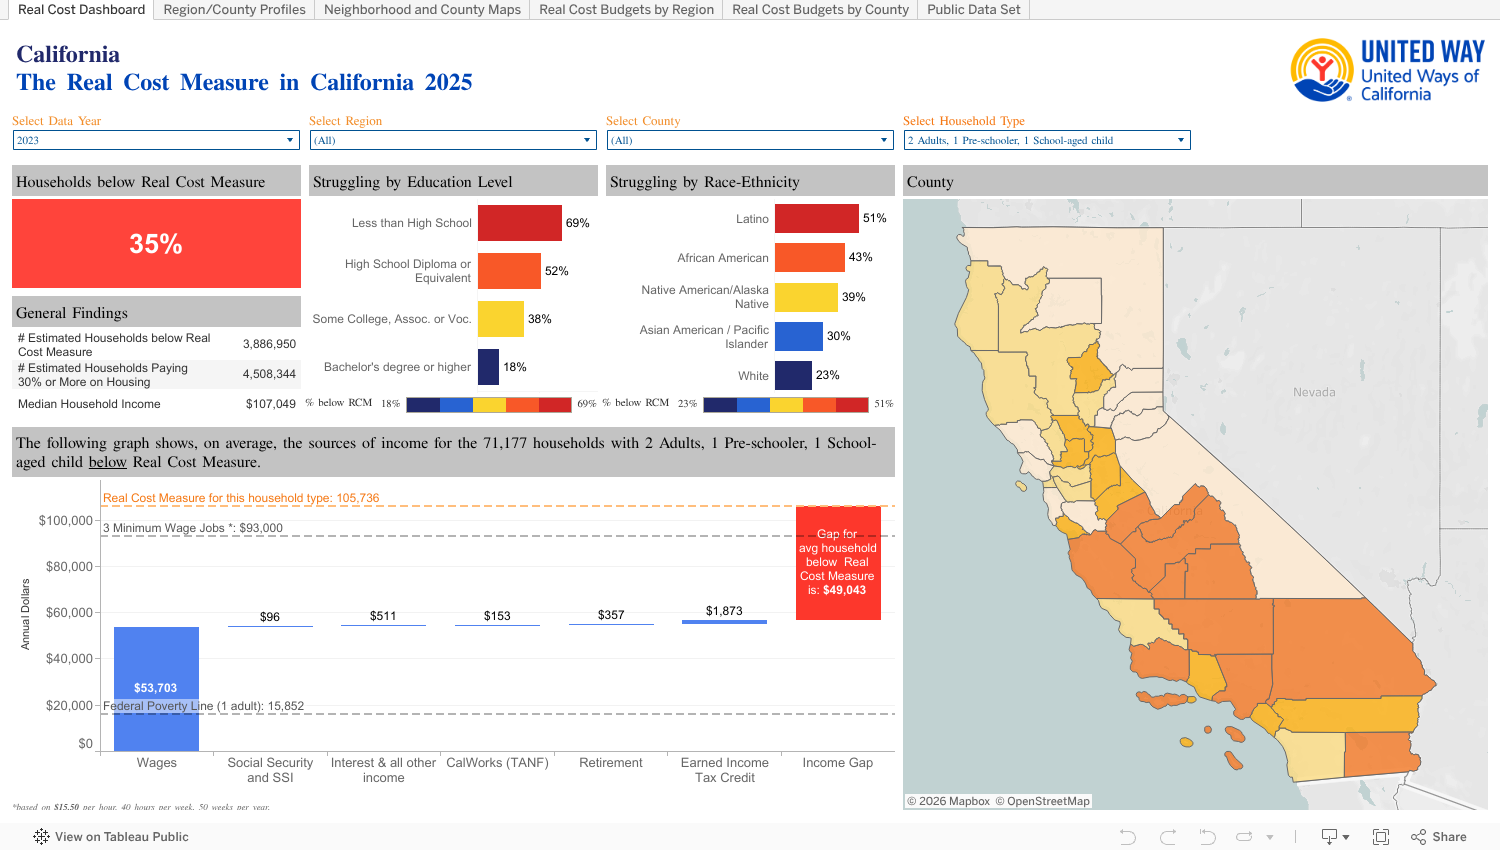
One in Three Households—Over 3.8 Million Families (35%)—Do Not Earn Sufficient Income to Meet Basic Needs in California
About 97% of these households have at least one working adult.
Potential approaches to explore:
- Increased wages
- Guaranteed or universal basic income programs
- Government-sponsored health and retirement benefits
Click here to get more detailed ideas for potential policy and system changes.
Most Households Below the Real Cost Measure are Latino or White
1.8 million Latino households and 1.2 million white households earn incomes below the Real Cost Measure. Households of color are disproportionately likely to earn below the Real Cost Measure, largely as a result of historic and systemic discrimination.
Potential approaches to explore:
- Making cash-back tax credits more accessible
- Increasing outreach about cash-back tax credits
Click here to get more detailed ideas for potential policy and system changes.
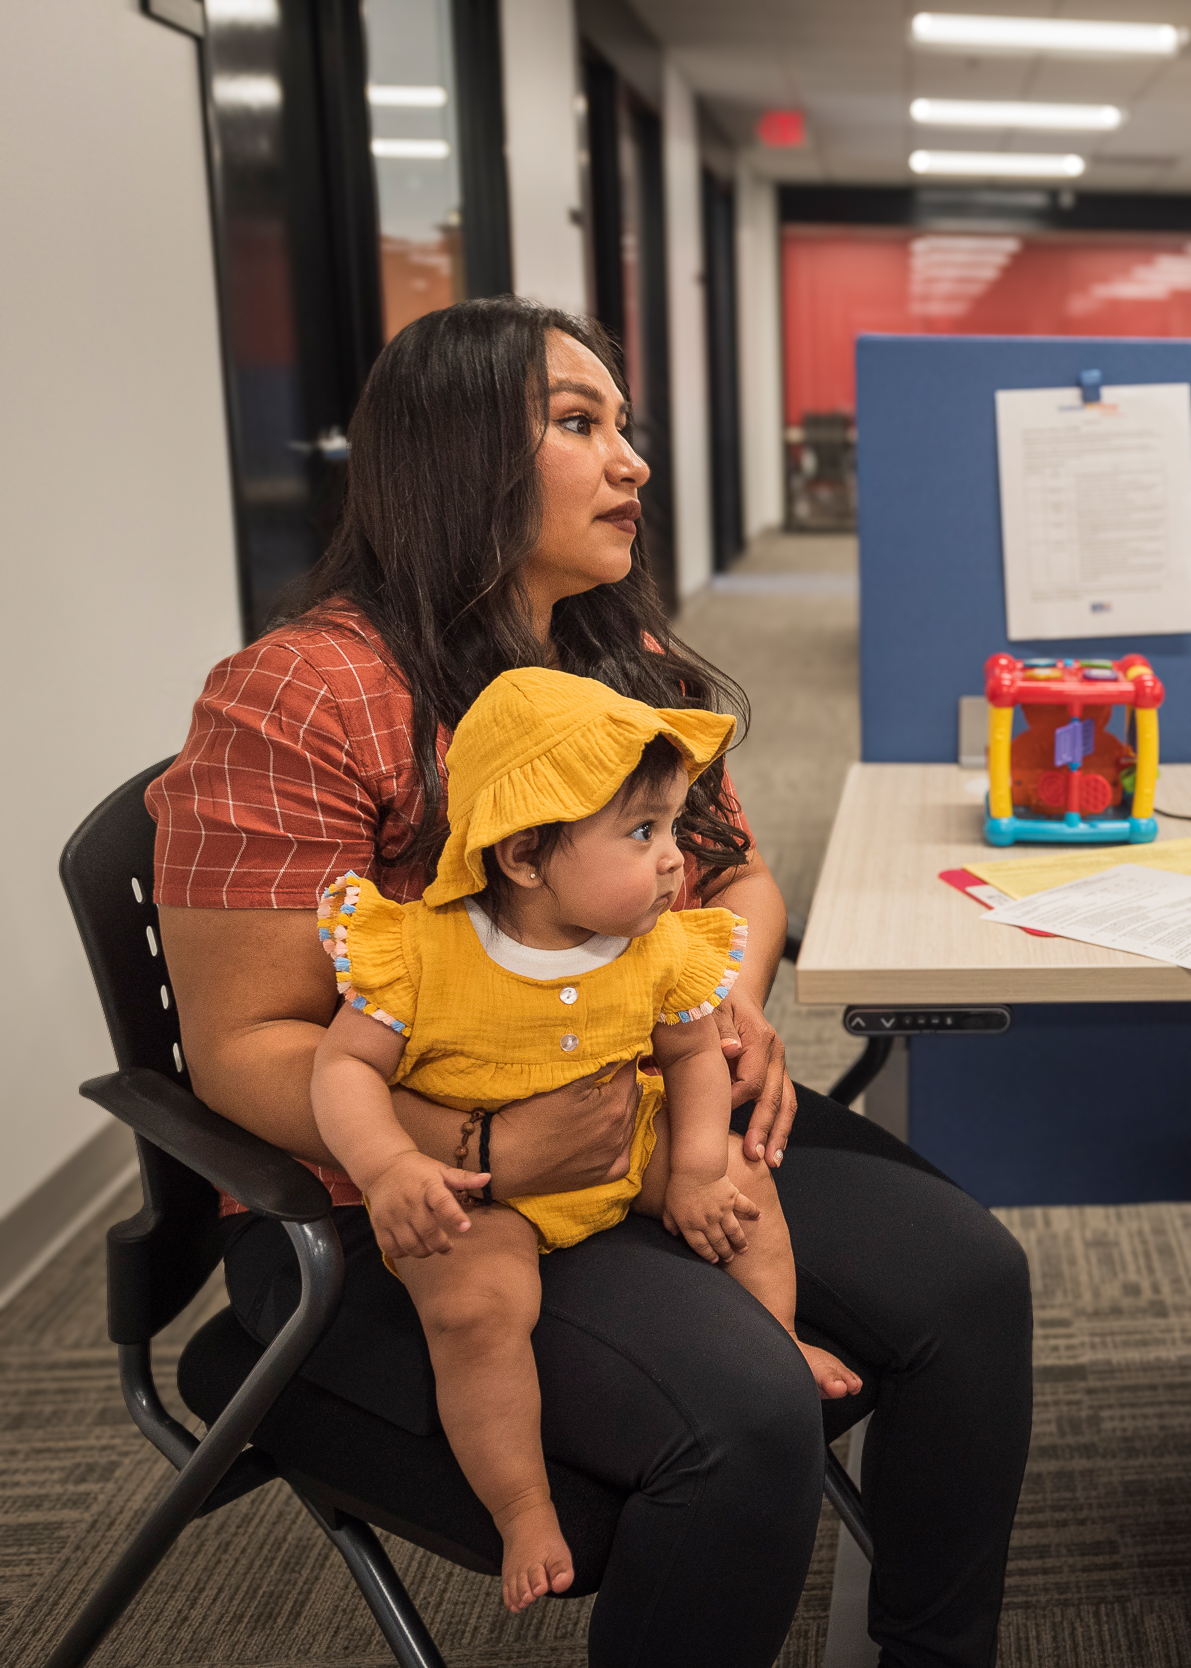
Over Half of Households with Young Children Fall Below the Real Cost Measure
54% of households with children under age 6—and 81% of single mothers with kids under 6—earn below the Real Cost Measure.
Potential approaches to explore:
- Affordable, quality early care and education
- Expansion of tax credits for Californians with young children
- Expand public benefits and streamline the benefit process
Click here to get more detailed ideas for potential policy and system changes.
Housing Costs Are Too High for Four in Ten Households
Over four in ten California households (40%, over 4.5 million) are "housing burdened," defined as spending 30% or more of their income on housing, whether they own or rent. When examining households under the Real Cost Measure, the rate of housing-burdened households jumps to nearly six in ten (57%, or about 2.2 million).
Potential approaches to explore:
- Expanding and maximizing renters’ tax credits
- Fully funding Section 8 housing vouchers
- Constructing more new affordable housing
Click here to get more detailed ideas for potential policy and system changes.
Note: United Ways of California has issued a correction to the previously shared statewide housing cost data above.
Financial Stability is More Common with Higher Education Levels
About two in three (69%) households led by a person without a high school diploma earn below the Real Cost Measure, compared to 18% for those with a bachelor’s degree or higher.
Potential approaches to explore:
- Increasing high school graduation rates
- Free or low-cost college
- Income-based student loan forgiveness and repayment programs
Click here to get more detailed ideas for potential policy and system changes.
Californians Born Outside the U.S. Often Face Greater Financial Challenges
Of households led by someone who is not a U.S. citizen, 58% are paid incomes below the Real Cost Measure, compared to 37% for those who are naturalized and 29% for those born in the U.S.
Potential approaches to explore:
- Supporting immigrant naturalization
- Expanding safety net services, regardless of immigration status
- Expanding supports for those eligible for Individual Taxpayer Identification Numbers (ITINs)
Click here to get more detailed ideas for potential policy and system changes.
Women-Led Households are Paid Less, at Almost All Levels of Education
Households led by women are paid less than those led by men at almost every level of education. This is largely due to gender discrimination, bias, and other societal norms and factors.
Potential approaches to explore:
- Implementing dual-generation strategies—such as offering child care and early childhood education along with educational opportunities for parents, especially single mothers
Click here to get more detailed ideas for potential policy and system changes.
“
Even with two incomes and family to help with child care, living in California is so expensive.”
— Ivonne Sonato-Vega,
mom of five in Sonoma County
.
Turning Insight into Action
United Way mobilizes communities to action so all can thrive. The Real Cost Measure helps California United Ways and our communities identify areas that need addressing and helps make a case for programs and initiatives—like advocating for expanded tax credits and providing free tax prep that ensures Californians earning low incomes claim every tax credit they’re entitled to—to help increase access to financial security. We also hope it provides a useful starting point for community conversations and advocacy to explore additional solutions.
Throughout the study and above, we’ve indicated opportunities to implement proven policies and supports to increase equitable access to financial stability in California. Key areas include:
- Preserving and expanding health coverage and access
- Expanding the reach and impact of income support programs, such as refundable tax credits, and implementing universal basic income programs
- Expanding the availability of housing and bolstering assistance for renters
- Streamlining benefit application processes
- Expanding access to free or low-cost higher education, including income-based student loan forgiveness and repayment programs
- Building a system where employment serves as a pathway to financial stability and prosperity
- Increasing wages
To learn more about each of these, explore potential approaches and solutions, and see questions designed to spur conversations, see our supplemental publication Building Economic Inclusion: A Call to Action.
Join us in taking action to help increase access to financial security, building a more equitable California for all.
.
See the Real Cost Measure in Your Region: Real Cost Measure Interactive Data Dashboard
The Real Cost Measure varies significantly throughout California.
Navigate the Real Cost Measure’s primary findings using the tool below. You can explore interactive county and neighborhood maps; statewide, regional, and county profiles; common household budgets; and more.
The dashboard on this page is best viewed on a desktop computer. If you’re using a mobile device, please view it here.
*The 2025 RCM Study draws from 2023 publicly available data.
.
Interactive Household Budgets Calculator
Our household budgets calculator contains approximately 1,200 budgets across California’s 58 counties, up to 19 adults in a household, to determine the minimum amount a household needs to earn to make ends meet in California. To use the calculator:
- Select the name of your county from the drop-down menu below.
- Enter the age of the first household member, and press the “Add person” button to add additional household members.
.
Resources
*Be sure to enable pop-ups to download your PDF
.
.
.
.
Interview and Speaker Requests
Schedule a media interview with one of the study’s authors or inquire about local speaking opportunities on the Real Cost Measure.
Partner with Us
Interested in funding or partnering with California United Ways on solutions to address disparities highlighted by the Real Cost Measure study?
.
.
.
Methodology
Learn more about the data sources and how we calculate the Real Cost Measure.
Previous Real Cost Measure Studies
Please note: In 2018, United Ways of California incorporated payroll taxes, child care tax credits and the U.S. Department of Agriculture Low-Cost Food Plan for more robust household budget calculations. Studies before 2019 will not reflect those changes.